
Estimated reading time: 5 minutes
A practical framework for more reliable project cost forecasts
One of the most notorious challenges in infrastructure projects is figuring out if the preliminary cost estimation is in fact realistic. Traditional approaches rely on expert judgment and fragmented historical data, with limited transparency around assumptions. RCF-AI addresses this by combining predictive modelling, explainability and reference class benchmarking in a single dashboard. In this case we apply RCF-AI to dyke reinforcement cost estimation.
This article walks you through the tool and shows how it helps answer three critical questions:
- What drives the predicted project cost?
- How should inflation risk be measured and incorporated?
- What can we learn from similar historical projects?
From data to insight: the Management Dashboard
The starting point is a centralized dashboard covering both historical and ongoing dyke reinforcement projects. Users can quickly search or select a project and immediately access its defining characteristics.
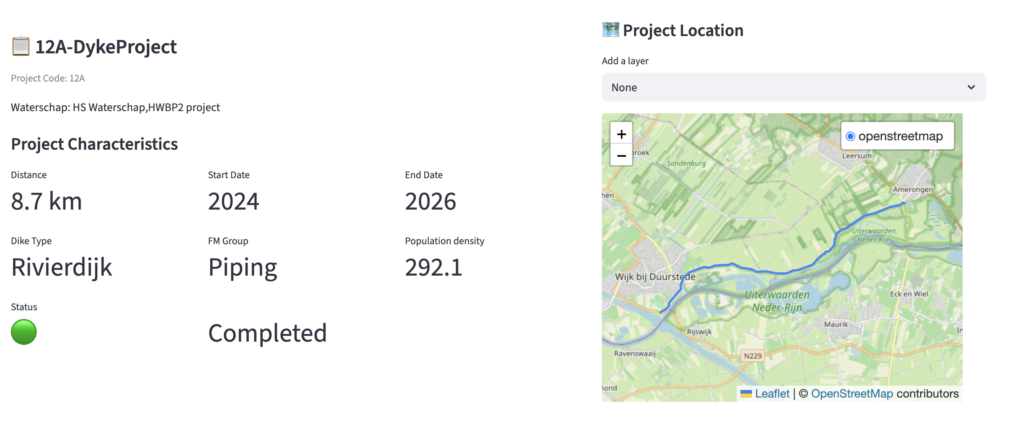
For example, selecting a river dyke project reveals key indicators such as:
- Project length
- Completion year
- Population density
- Main failure mechanism group
The project is also displayed on a map as a polygon, providing geographic context for the estimation.
Predicting cost with context
At the core of the tool is a predictive model that estimates cost per kilometer based on the selected project characteristics. The model incorporates 50+ project features, including:
- Geospatial data (soil type, residential area overlap)
- Environmental constraints (Natura 2000 zones)
- Technical characteristics (failure mechanisms, design complexity)
For completed projects, users can compare the model-predicted cost against the actual cost (inflation-adjusted) – providing a direct validation of model performance and building trust in its outputs.
For ongoing projects, the model serves as a forward-looking estimate—grounded in empirical data rather than intuition alone.
Opening the Black Box: cost driver explainability
Predictions alone are not enough. Decision-makers need to understand why a project is expected to cost what it does.
RCF-AI makes this possible through a built-in explainability layer that breaks down each cost prediction into its contributing factors.
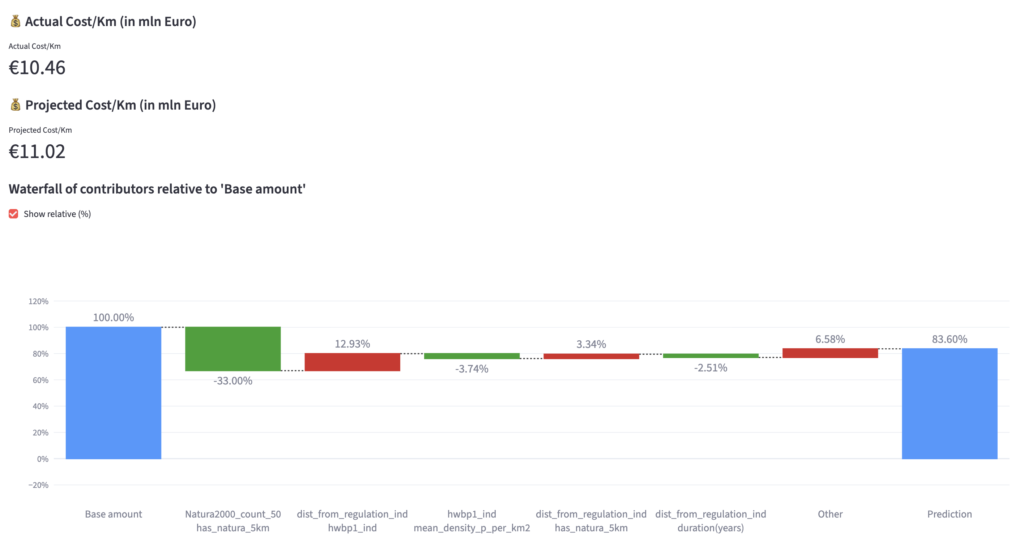
The dashboard includes a waterfall chart that breaks down how each project characteristic influences the predicted cost relative to a baseline.
For example:
- Overlap with protected environmental areas may affect costs
- Lower risk reserves may decrease expected costs
- Certain soil types or urban density levels may significantly shift the estimate
A supporting table highlights the top contributing factors, ensuring transparency and auditability.
This transforms the model from a “black box” into a decision-support system, allowing experts to:
- Challenge assumptions
- Identify cost sensitivities
- Communicate findings clearly to stakeholders
Measuring what matters: Inflation risk
Inflation is one of the most underestimated risks in infrastructure cost estimation.
Rather than relying on generic indices, the tool introduces a dyke-specific inflation framework based on three steps:
- Break down the project cost structure into its key components
- Identify the main cost drivers – such as labour, steel and asphalt
- Construct a custom inflation index weighted by these components
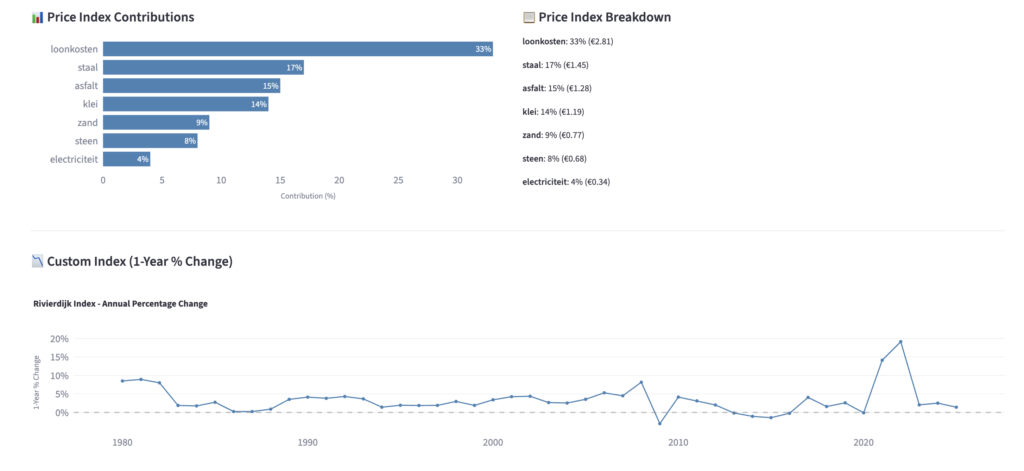
This allows users to:
- Track historical dyke-specific inflation trends
- Estimate forward-looking inflation risk tailored to the project
- Integrate inflation uncertainty directly into cost forecasts
The result is a substantially more realistic view of future materials costs and associated risks.
Learning from the past: Reference Class Forecasting
Even the best models benefit from grounding in reality. That is where the reference class framework comes in.
Instead of only asking: “What do we think this project will cost?”
We also ask: “What did similar projects actually cost?”
The system automatically identifies comparable historical projects based on multidimensional similarity across:
- Technical characteristics
- Geographic features
- Environmental constraints
For each comparable project, users can view its key attributes and actual cost outcomes:
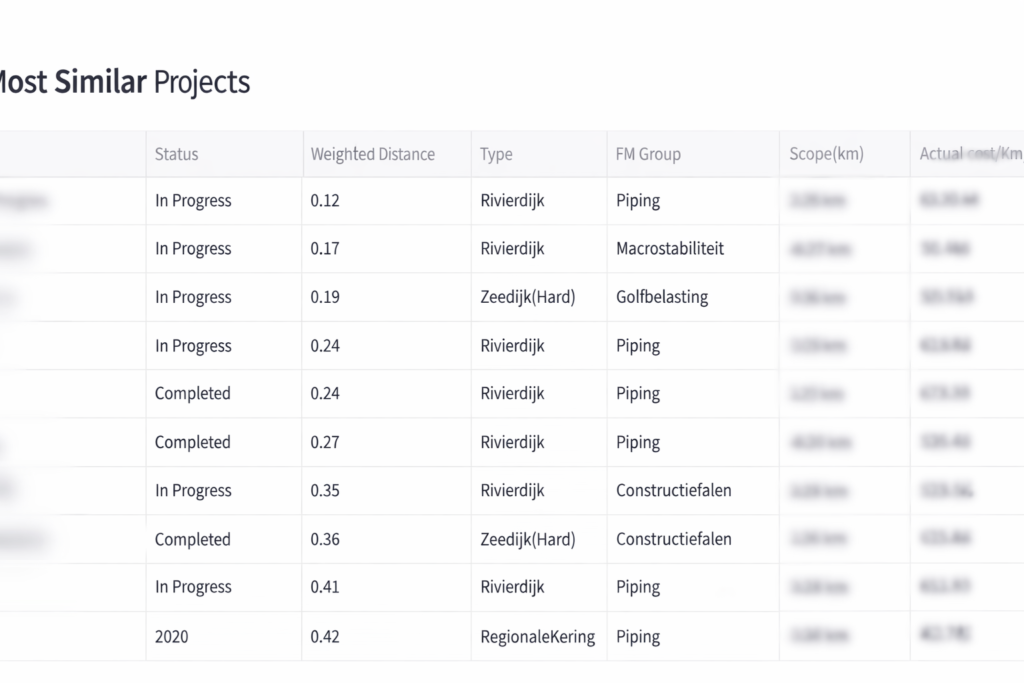
From this, the tool generates a cost distribution of comparable projects, showing where the current estimate falls relative to historical reality.
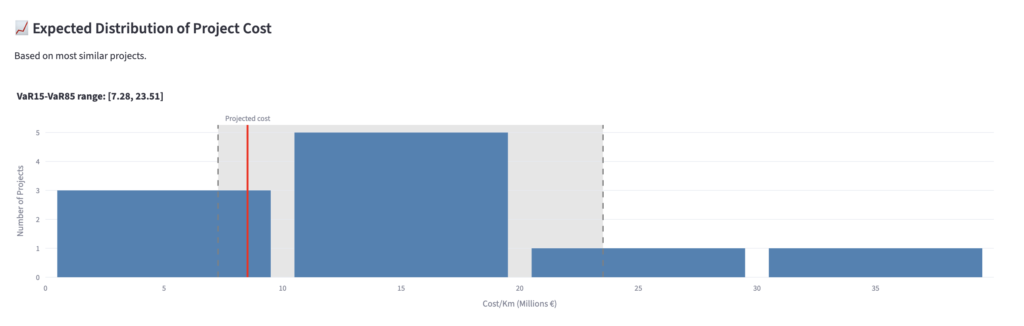
This provides a powerful reality check:
- Is the estimate aligned with past outcomes?
- Is it overly optimistic or conservative?
- Should we revisit assumptions?
Final thoughts
The strength of this tool lies in combining three complementary perspectives:
- Model-based prediction — data-driven and scalable
- Explainability — transparent and interpretable
- Reference class benchmarking — grounded in real-world outcomes
Together, they provide a robust evidence base for decision-making.
The goal of this solution is not to replace expert judgment—but to strengthen it.
By integrating AI with domain knowledge and historical data, the tool helps project teams:
- Increase confidence in early-stage estimates
- Identify risks before they materialize
- Make more informed, defensible decisions
In a field where uncertainty is inevitable, better insight is the most valuable asset.
Request a demo on RCF-AI, read more about the HWBP pilot results, the methodology, validation and the coverage:
-
Fred Schulte Fischedick

-
Fred Schulte Fischedick
