
Estimated reading time: 8 minutes
Quantify how changing market conditions affect the financial risk of land-development portfolios
The Land Development Risk Tool helps municipalities, developers, and public finance teams quantify how changing market conditions and changing project exposures affect the financial risk of land-development portfolios.
It supports reserve reviews, portfolio steering, and project decisions by combining current project data with validated macro-regime risk profiles.
Land-development risk changes over time. A project that looked acceptable under one economic context can carry a very different risk profile when interest rates, house prices, construction costs, sales volumes, or phasing assumptions change.
The tool uses macro-regime risk profiles to quantify how those changing conditions affect downside risk.
What the tool helps you answer
The Land Development Risk Tool helps answer questions such as:
- How sensitive is the portfolio to land-price, cost, timing, or volume risk?
- Which projects contribute most to portfolio risk?
- What is the financial impact of continuation, postponement, acceleration, or stopping decisions?
- Are current reserves still sufficient?
- How has the risk profile changed compared with a previous model version?
- Can the current risk position be explained clearly to management, auditors, council, board, or investment committee?
Why this approach is different
Traditional risk assessments often rely on fixed assumptions, periodic scenario updates, or expert judgement. These approaches can be useful, but they often make it difficult to separate changes in project exposure from changes in the economic risk environment.
The Land Development Risk Tool links project-level exposure to risk profiles that depend on the economic context.
As a result, the tool helps distinguish whether a change in risk is caused by project exposure, market conditions, assumptions, phasing, or portfolio composition.
Evidence behind the model
The land-price risk module is supported by a Dutch historical reconstruction of residential residual land prices and house sales volumes over the last century since 1914.
The research shows that land-price risk is strongly regime-dependent: similar economic and housing-market conditions can produce downside profiles that differ materially from the long-term historical average.
The model was validated using historical backtesting and an unseen holdout period. In these tests, the combined regime-based model produced substantially better model-cost performance than static historical benchmarks, while maintaining downside-risk outcomes consistent with the selected confidence level.
This supports the use of regime-dependent and ensemble risk estimates when reserve levels and downside exposure need to be explained or defended.
Validation note
In the unseen holdout validation, the combined regime-based land-price model reduced model costs by approximately 38% compared with the static historical benchmark. Model cost measures the trade-off between downside protection and unnecessary conservatism. Lower model cost means the model produced a more useful risk estimate for reserve and decision support.
Based on the RCF-AI modelling approach
The Land Development Risk Tool is a domain-specific module based on RCF-AI, an AI/ML-driven Reference Class Forecasting modelling approach.
It starts from real historical data, validates risk estimates out-of-sample, makes the main risk drivers transparant, and adds context-dependent modelling where this improves performance.
Applied to land-development portfolios, this means current project exposures are combined with validated macro-regime risk profiles to support reserve, phasing, and portfolio decisions.
How it works
The tool follows a structured workflow from project data to decision-ready reporting.
Load project planning
Projected revenues, costs, timing assumptions, and exposure data are imported fromTotalLink or other source systems through an automated interface.
Adjust mappings
Revenue and cost items are mapped to the relevant risk categories.
On the revenue side both price and volume risk are available. Price risk covers decreases in land prices and volume risk decreases in the number of units sold.
On the cost side you will find relevant risk factors like site preparation, preparation for residential use, and planning costs. For each of them the associated price and volume risk is available. Price risk is related to a potential increase in the costs per unit built. Volume risk reflects changes in the number of units that can be constructed in a negative scenario. Because fewer units are developed, this has a decreasing, and therefore positive, effect on the costs.
Calculate the risk
The tool runs quantitative risk calculations across scenarios and produces both detailed and aggregated outputs.
Detailed risk reports
A detailed web-based risk report shows the projected budget under different scenarios, using the applicable price and volume risk profiles.
The tool estimates risk from multiple perspectives, including:
- Risk versus budget: downside risk relative to the current project budget.
- Risk versus expected scenario: downside risk relative to the expected outcome.
- Risk versus maximum capacity: downside risk adjusted for postponed sales or unused capacity.
The tool also accounts for phasing effects. In negative scenarios, unsold capacity may remain after the projected period. The risk calculation can therefore adjust for postponed sales and the timing of future revenues and costs.

Aggregated risk reports
Aggregated reporting combines all project-level information into a portfolio view of revenues, costs, results, cumulative outcomes, and net present value across scenarios.
Users can adjust key assumptions, including:
- risk appetite through a selected certainty percentile
- inclusion or exclusion of postponed revenues and costs
- price changes on revenue and cost items
- volume changes with positive or negative timing tilts
- portfolio aggregation and correlation effects
Because not all risks occur simultaneously, the portfolio calculation includes correlation effects across risk drivers and projects.
The final report provides a consolidated view of portfolio risk, reserve impact, and downside exposure across the selected scenarios.

A cloud-based interface for recurring risk management
Within a secure environment, users can access the latest risk calculations and compare them with previous year’s exposure or with other model versions.
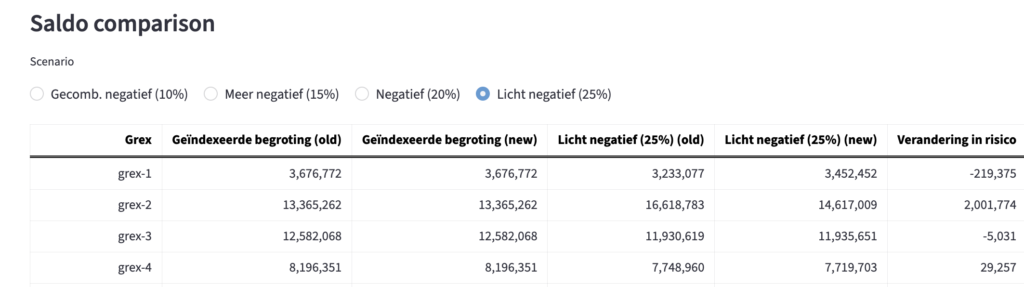
The comparison view shows the projected budget versus downside scenario budgets for each land-development project. Risk calculations are shown across multiple scenarios, from slightly negative to very negative, allowing clients to align the analysis with their own risk appetite.
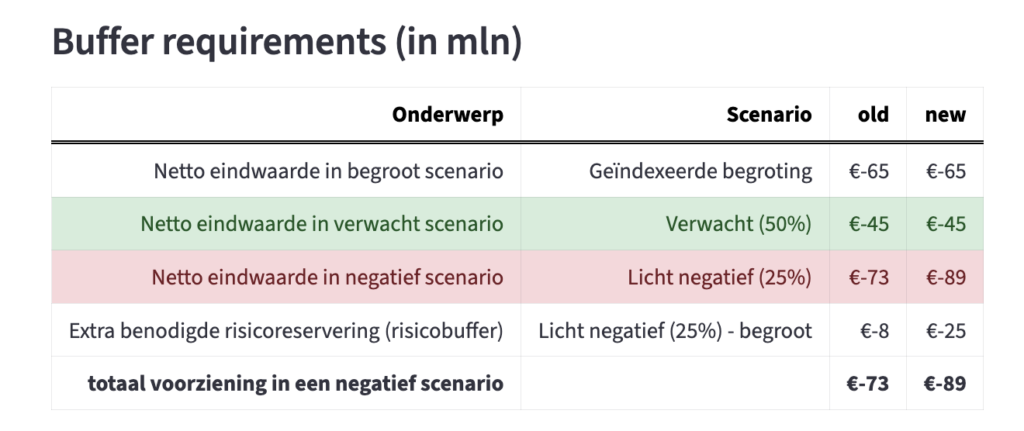
A primary focus is understanding reserve requirements and how these evolve between model versions. The tool therefore includes an aggregated portfolio view across all projects, showing the total reserve impact.
The interface also helps explain what drives changes in outcomes. Visualisations show the predicted risk profile for each key risk factor. By comparing current and previous model outputs, users can see how shifts in calculated risk levels contribute to the overall change in portfolio risk.
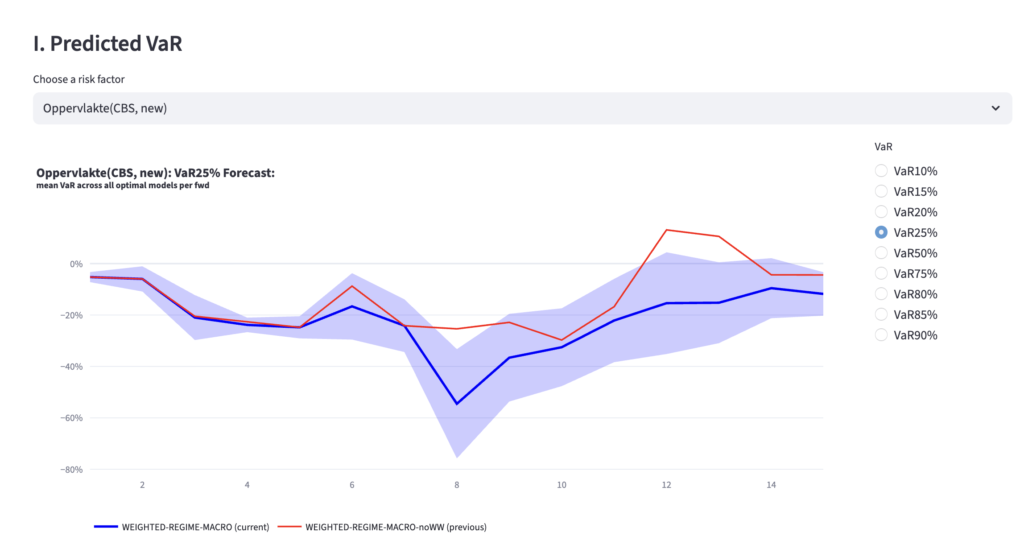
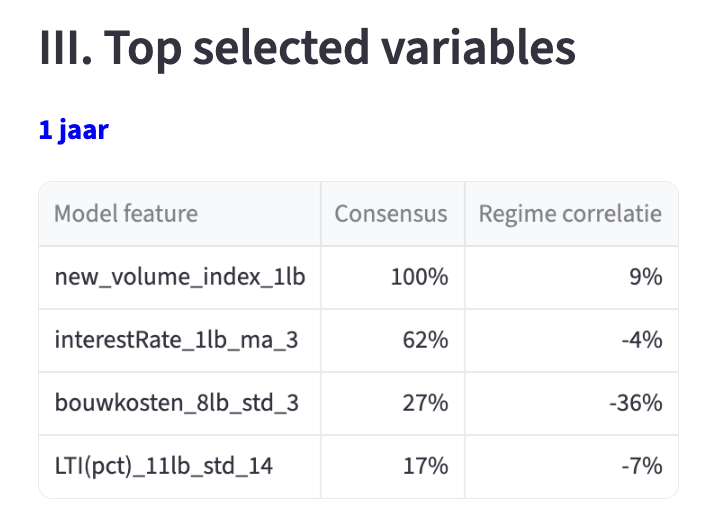
Transparency is central to our approach. For the key risk drivers, we apply advanced, context-driven macro-regime models to estimate risk levels. The underlying macroeconomic drivers and the most comparable periods vary over prediction-horizon but also over time, so we show the exact drivers and periods that are shaping each risk forecast.
Why teams use this tool
Teams use the Land Development Risk Tool when they need a current, consistent, and defensible view of land-development risk.
It is especially relevant when:
- market conditions have changed;
- project exposures or phasing assumptions have been updated;
- reserves need to be reviewed or defended;
- because generic macro assumptions do not reflect actual project sensitivity;
- project and portfolio decisions need to be compared on a consistent basis.
Practical first step
A practical first step is to start with a portfolio risk scan for a selected portfolio or a small group of representative projects.
The scan can provide:
- a quantified view of current downside exposure
- an assessment of reserve adequacy
- the main project and market risk drivers
- a comparison with the current buffer or scenario logic
- an indication of which projects contribute most to portfolio risk
- a practical view on whether recurring risk reporting would add value
This creates a focused first result without requiring a full organisation-wide implementation.
Need better insight into land-development portfolio risk?
Move beyond static assumptions and quantify how changing market conditions and project exposures affect reserves, phasing, and portfolio decisions.

