Estimated reading time: 6 minutes
In residential real estate development projects historical land price risk plays an important role. Land price is defined as the difference between the market value of the property and its construction costs1 ; it is also known as the residual value. It represents the additional value over the construction cost of the property. It is the add-on that people are willing, or are able, to pay to live in a certain area.
As property prices and construction costs change due to market forces, the residual land value can become quite volatile. This represents an important risk factor for landowners andland developersas their result largely depend on changes in these residual values.
Key questions for land and project developers are therefore:
- How much did land prices change historically ?
- What is the land price risk in the current environment?
- How reliable is the risk estimate?
To answer these questions, we start with an historical overview of land prices since 1914. Next, we create context-dependent risk estimates using a regime-based risk model. We measure the reliability of the estimation by performing out-of-sample backtests and compare the performance to a standard risk model. Finally we discuss the implications for land owners.
Land price history: more than one century of data
As land prices can be obtained as the difference between market property prices and construction prices, we can reconstruct the historical residential land price from these two components.
The graph below shows both new house prices, construction costs and the derived land prices since 1914 for an average house in the Netherlands:

We observe that average new home prices have increased significantly over the last century, from 11k to 501k, or with 3.6% (CAGR) per year. Construction costs have increased to 308k. By the end of 2023 the average residential residual land value in the Netherlands was therefore 193k, or 38.5% of the total market price.
Land price movements are not constant over time. In addition, we note that the dynamics become cyclical. For longer projection horizons which we typical observe in development projects, this therefore leads to larger increases and decreases. The graph below presents the 4-year look-back percentual changes of land prices.

We clearly observe alternating cycles: 6 periods with increasing land prices and 6 periods with decreasing land prices. The dashed line shows that in 20% of the years land prices decreased with more than 42% over a 4-year horizon. However, the graph also shows 4 periods with land price decreases up to -100%: both World Wars, the ‘70s and the ‘80s. In these periods construction costs increased much more than property prices, which led to falling land prices.
Regime-based land price risk estimation
As land price risk depends substantially on the macro-economic context, we want to account for the relevant drivers when we estimate risk. A regime-based risk model grounded in Reference Class Forecasting principles allows us to do this. Using Predictive Reference Class Retrieval (Predictive RCR) we identify both the macroeconomic and other drivers that best explain movements and risks in land prices and the historical years that are most relevant and comparable.
When we apply a walk-forward validation over the last 70 years we obtain the following back-test results for a 1-year horizon forecast:
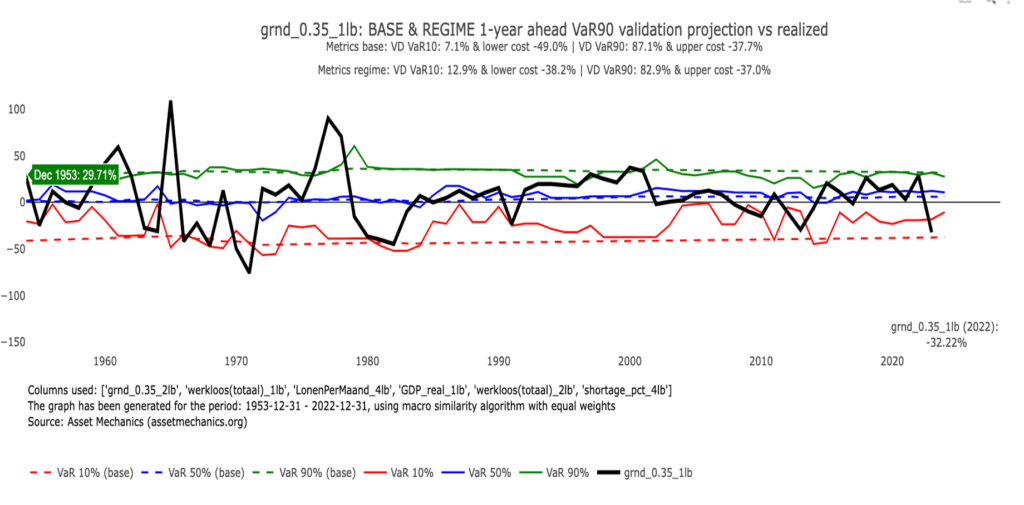
We observe that the regime-based model is much more accurate and adaptable than a standard historical risk model. Furthermore, the regime-based model adapts better to changing regimes as can be seen by lower model costs. The regime-model is on average less conservative and more agile. Therefore we become more resilient in changing environments, which enables better decision-making.
Validations on holdout set
In addition we have also validated a combined set of best models on a holdout-set over the last 20 years. We found the following results:
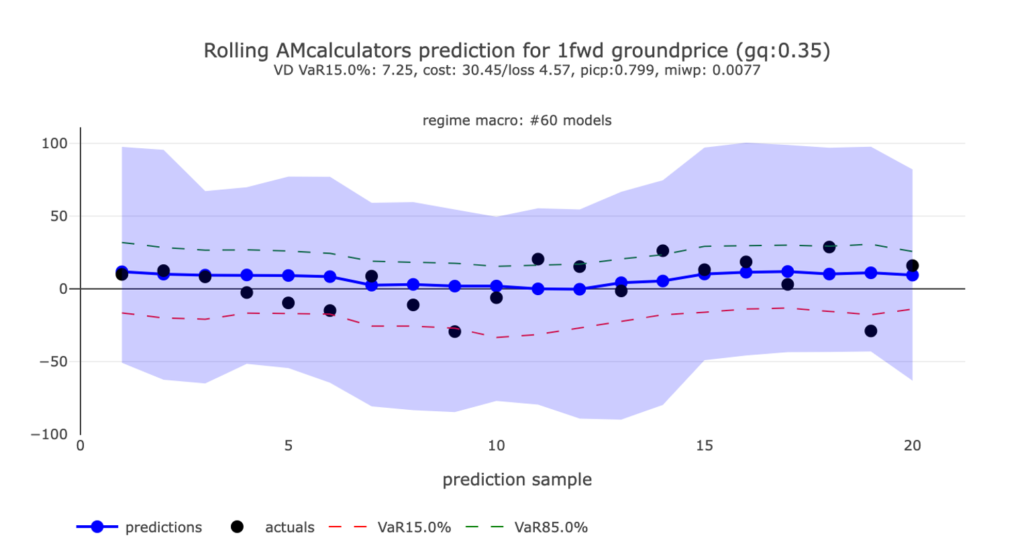
It is good to see such a strong confirmation that our model works properly on unseen data over the last 20 years.
A distinctive standard of transparency in long-term land-price risk forecasting
Long-term risk forecasts are often presented as probability distributions without publicly documented evidence of how reliably they predict unseen outcomes.
To our knowledge, Asset Mechanics is the only provider we have identified that documents 20 years of out-of-sample validation of P15 land-price risk forecasts across prediction horizons of 1–10 years, reporting both empirical coverage and quantile (pinball) loss.
Detailed model-specific evidence and limitations are documented in our system cards. Read more about how we empirically validate risk forecasts.
Implications for landowners
Land-price risk can vary substantially across economic regimes. A static historical risk model does not capture these changes well and may therefore result in unnecessarily large buffers during lower-risk periods.
By making risk estimates conditional on the relevant economic context, the regime-based model provides a more adaptive basis for both buffer allocation and strategic decisions. This helps landowners determine when projects can proceed as planned and when changing conditions warrant adjustment, postponement or reconsideration.
We cannot know the future path of land prices with certainty. But by identifying the historical evidence most relevant to current conditions, the model provides a better-founded view of the range of possible outcomes and supports decisions accordingly.
The methodology is implemented in our Land Development Risk Tool, where it can be applied to specific land portfolios and changing economic conditions. Learn more about the tool, or reach out if you would like to see it in action.
- Construction costs including VAT and profit margin for the contractor / project developer ↩︎